


Claims inflation, catastrophe losses and affordability pressures put Australian insurers’ decisions under strain. The Insurance Council of Australia reported more than A$3.98 billion in insured losses from seven declared events in 2025-26. A shock can affect profit, cash, capital and service together. [6]
Yet Finance, Actuarial, Underwriting, and Investments often rely on separate forecasts, assumptions, and data. The problem is not spreadsheets alone: disconnected ownership and manual reconciliations can delay joined-up decisions.
Enterprise Performance Management (EPM) connects approved specialist outputs with financial and operational forecasts. A governed planning layer helps teams test shared scenarios without replacing actuarial, accounting, or policy systems.
EPM’s value goes beyond faster reporting: it supports better cross-functional decisions. This article explores why investment matters now, practical use cases in insurance and how to modernize planning without starting with a platform choice.
Building on Alpha’s recent Beyond the Pilot white paper [10], this article takes a deeper look at EPM and why connected planning is particularly timely for Australian insurers.
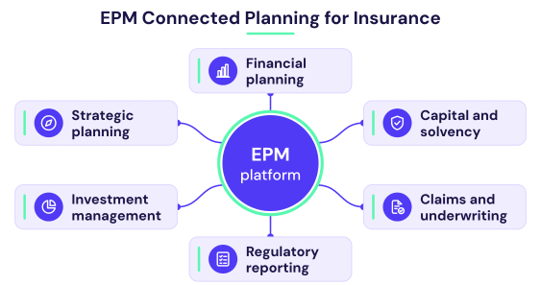
One change can affect profit, cash and capital. Connected models help teams assess these effects together.
The Questions Insurers Need to Answer
| Business pressure | Question for the plan |
| Claims costs | What happens if claims are more frequent or more expensive? |
| Capital | Can we support growth and still absorb a shock? |
| Reporting | Can we explain the figures and trace them to their source? |
| Risk Management | What happens when several problems occur together? |
| Customer service | Do we have the people and funding to handle demand? |
EPM connects premiums, claims costs, capital and investment income in one planning process. Shared assumptions, clear ownership and approved source calculations matter as much as the platform.
Priority Use Cases
1. Claims and Underwriting
Connect premium plans with expected claims, expenses and reinsurance assumptions. Finance and underwriting teams can assess profitability by product or portfolio and compare the implications of changes in pricing, claims frequency, severity and retention.
For example, assume earned premium is A$100 million and expected claims are A$65 million. If the average cost per claim rises by 10%, with claim numbers unchanged, expected claims rise to A$71.5 million.

Illustrative example. Claims rise by A$6.5 million before reinsurance and other effects.
The claims ratio moves from 65% to 71.5%. Teams can compare pricing changes, reinsurance options and claims-management improvements, while considering customer outcomes and service capacity. Actuarial specialists remain responsible for approving reserve assumptions.
2. Capital and Solvency
Connect business forecasts to approved specialist capital-model results. Leaders can then assess whether growth plans, catastrophe scenarios and other stresses leave sufficient capital headroom. APRA requires Australian general insurers to assess capital needs and conduct stress testing through the Internal Capital Adequacy Assessment Process (ICAAP). [1]
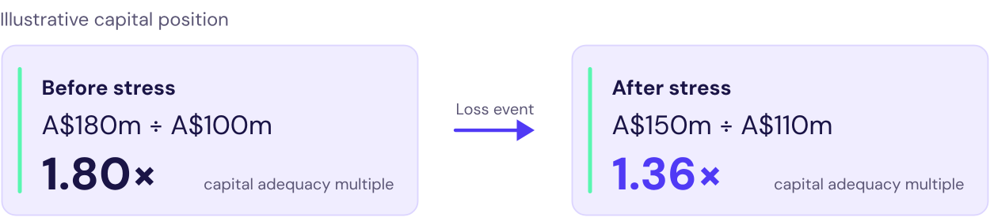
Capital adequacy multiple = eligible capital base ÷ prescribed capital amount. Figures are illustrative.
In this example, a loss reduces available capital while the prescribed amount rises. The multiple falls from 1.80 to 1.36. Management can compare the result with its target and assess changes to growth, reinsurance or capital. Regulatory compliance must also take account of any APRA supervisory adjustments. [1]
3. Financial and Regulatory Reporting
Bring approved finance and actuarial results into a governed reporting process, with clear data lineage, reconciliations and sign-offs. Teams can explain movements and trace published figures to their underlying sources rather than reconstructing them after the fact.
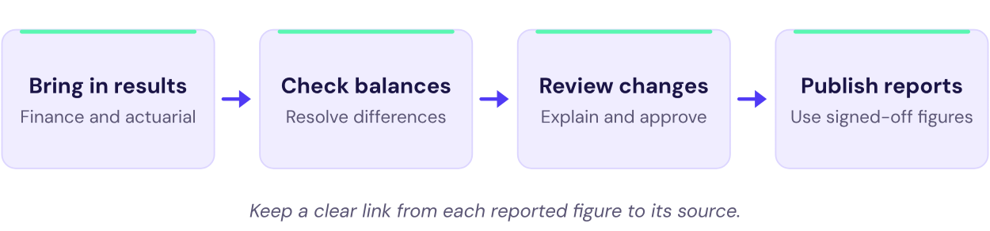
A proposed reporting workflow. Each stage needs a clear owner and a recorded review.
Australian insurers use AASB 17 for insurance-contract accounting. It is based on IFRS 17, which recognizes profit as insurance services are provided and requires losses on loss-making groups to be recognized immediately. Premium receipts are therefore different from insurance revenue. [2, 3]
EPM can connect approved AASB 17 outputs, business forecasts and management reports, while maintaining a clear audit trail of assumptions and adjustments. Specialist accounting and actuarial systems remain responsible for their underlying calculations. Useful measures include reporting cycle time, unexplained differences, and manual adjustments.
4. Investments and Cash Planning
Compare forecast premium receipts and claims payments with available cash, investment maturities and expected investment income. Connecting Finance and Investments helps leaders anticipate liquidity needs and assess potential asset sales alongside profitability and capital implications.
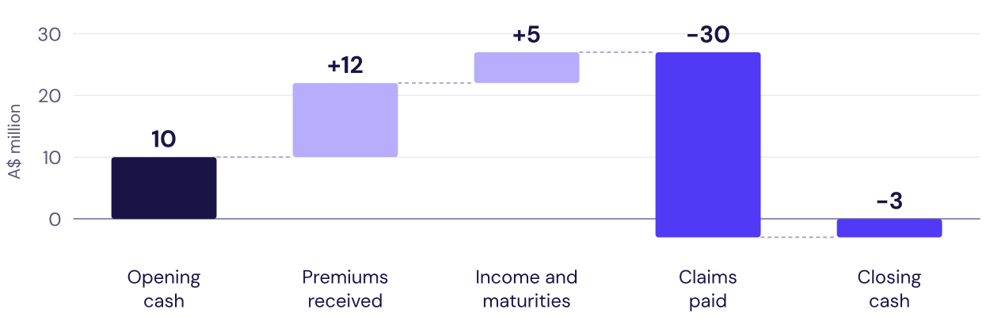
Illustrative cash forecast. Opening cash plus receipts of A$17m cannot cover A$30m of claims payments.
Here, the forecast shows an A$3 million funding gap. Teams can assess available cash, maturing investments and possible asset sales before payments fall due. The wider plan should also consider investment income, market losses and capital effects. [4]
The Australian Insurance Market
Australia’s insurance sector remains well capitalized and profitable overall according to APRA, but claims costs, affordability and changing customer needs continue to complicate business planning. Priorities vary by sector and by insurer. [5]
| Sector | What to connect in the plan |
| General insurance | Pricing, customer retention, claims costs, catastrophe exposure and reinsurance. |
| Life insurance | Policy lapses, claims experience, product sustainability and expenses. |
| Private health insurance | Membership mix, health-service use, benefit costs and affordability. |
Planning priorities based on the pressures identified by APRA. [5]
Claims Inflation Needs Its Own Assumptions
Repair costs do not always move in line with everyday prices. The Insurance Council of Australia reported the following increases over the five years to March 2026. [6]
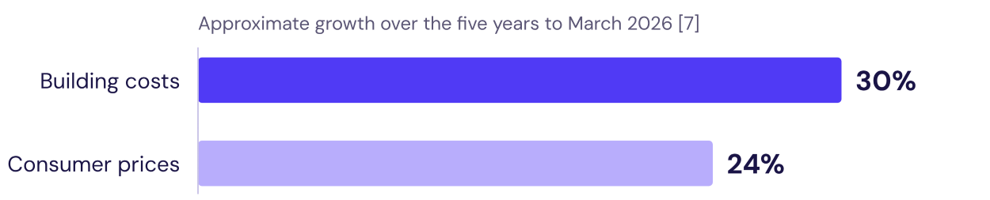
Source: ICA, 1 September 2026, citing Cotality construction-cost data. Percentages are approximate. [6]
For property insurers, this means testing repair-cost assumptions by region and type of work. The same ICA release reported more than A$3.98 billion in insured losses from seven declared events in 2025–26. Those figures cover declared events, rather than all industry claims. [6]
Use Australian Requirements
Planning models should connect to approved AASB 17 results and the APRA capital and reporting requirements relevant to the insurer. CPS 230 places obligations on operational risk management, business continuity and service-provider oversight; an EPM implementation should therefore address access, recovery, data ownership and control design. EPM supports management information but does not itself satisfy prudential or accounting obligations. [3, 4, 7]
Claims handling and pricing decisions also affect customers. A useful plan tracks service measures alongside cost, so that savings do not hide delays or poor outcomes.
The Case for Action
Consider an illustrative severe-weather event. Higher claims frequency and repair costs affect expected profitability; claims-handling capacity may need to expand; payments can accelerate; and capital headroom may tighten. If functions are working from different assumptions, management may spend critical time reconciling forecasts rather than comparing responses.
Connected planning lets an insurer test that same shock across underwriting, profit, liquidity, workforce and capital in a common planning cycle. Management can compare actions such as reinsurance adjustments, repricing, liquidity measures and temporary claims resourcing while understanding the trade-offs.
The potential value is financial, operational and strategic: clearer portfolio profitability and capital use, less manual reconciliation and faster scenario cycles, and better-informed choices when conditions change. Insurers should measure these outcomes against their own baseline rather than assume a particular platform guarantees them.
Why the Timing Matters
Several pressures are converging: volatility in claims and repair costs, demand for more transparent financial and capital reporting, pressure to simplify fragmented legacy processes and interest in AI-assisted analytics that depends on trusted data. APRA’s 2026–27 program includes reviews of operational and technology risk at general insurers; ASIC’s September 2026 priorities include premium disclosure and home-building cash settlements. [8, 9]
These developments place a premium on clear ownership of data and calculations across Finance, Actuarial, Underwriting and Investments. AI cannot compensate for inconsistent source data or unclear model governance. A claims-capacity plan, for example, should connect staffing costs with workload and waiting-time measures; operational systems must supply the evidence needed to assess outcomes.
Start With One Decision
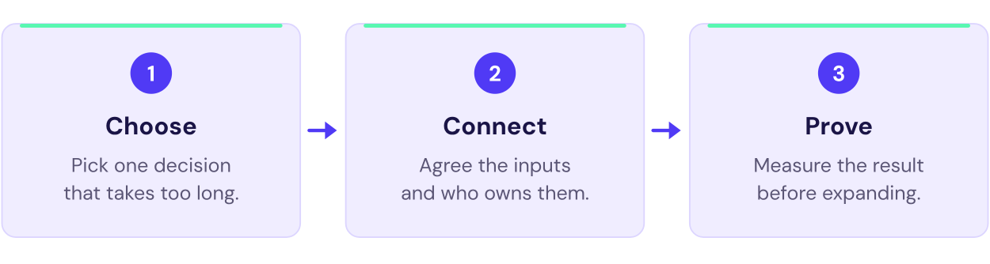
A practical starting approach. Expand once the first use case works and its value is clear.
Begin with one high-value decision that is currently difficult or slow—for example, refreshing a claims outlook or assessing the capital effect of growth. Establish a baseline for planning cycle time, forecast accuracy and manual effort; agree the decision owner, data sources, calculation responsibilities and review controls before building the solution.
Assess data readiness and relevant regulatory requirements at the outset rather than treating them as late-stage checks. Fund governance and integration as explicit workstreams, and deliver an initial measurable use case before expanding. Include licenses, integration, training, change management and ongoing support in the business case.
A Reference EPM Architecture
Alpha’s Beyond the Pilot white paper argues that modernization succeeds when governance, ownership, data and platform decisions are considered together [10]. The reference architecture below applies this thinking to Enterprise Performance Management, showing how insurers can connect existing systems to a common planning and reporting framework.
Investment, accounting, general ledger, actuarial and workforce systems feed a dedicated data integration and governance layer. Governed inputs can then support EPM consolidation, forecasting, scenario analysis, and reporting. Specialist actuarial, reserving and regulatory calculation engines remain responsible for their approved outputs: the role of EPM is to connect those results to wider financial and operational decisions.
For Australian insurers, the aim is to understand how changing claims, pricing or investment assumptions affect profitability, liquidity, capital and operations together. This is a platform-agnostic reference model, not a prescribed architecture; the figure retains examples from the global white paper, including CUSIP identifiers and Solvency II/Lloyd’s reporting, which would be adapted to applicable Australian identifiers and APRA/AASB 17 requirements.
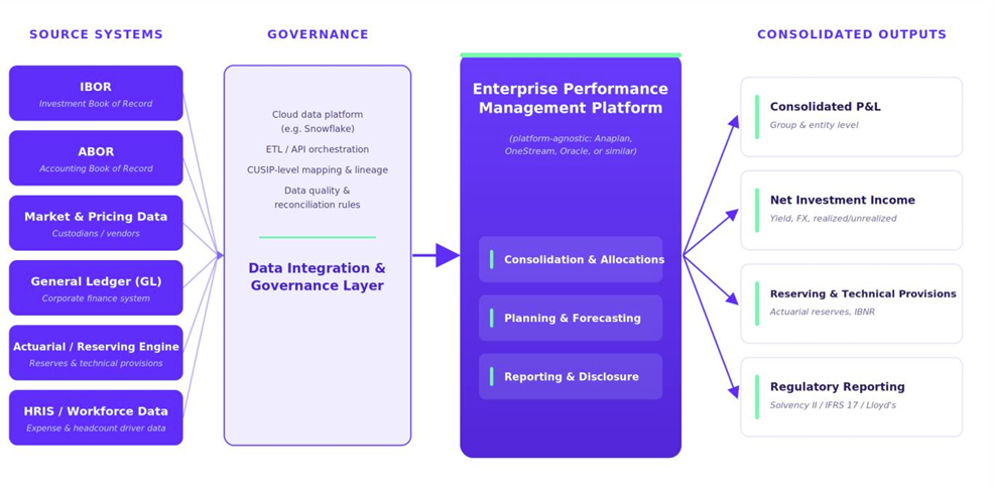
Reference architecture reproduced from Alpha FMC, Beyond the Pilot (September 2026) [10]. The diagram illustrates global insurance requirements and should be localized for Australian use.
How Alpha Can Help Insurers
Our Approach: Diagnose, Design and Deliver Connected Planning
Turning this reference architecture into an operational capability requires a clear future-state model and a practical delivery roadmap. Every insurer has distinct business priorities and planning challenges. Alpha helps Finance, Actuarial, Underwriting, Risk, Investments, Operations and Technology teams assess their current planning operating model, identify the decisions that matter most and define a target state grounded in clear ownership, sound data and practical implementation priorities.
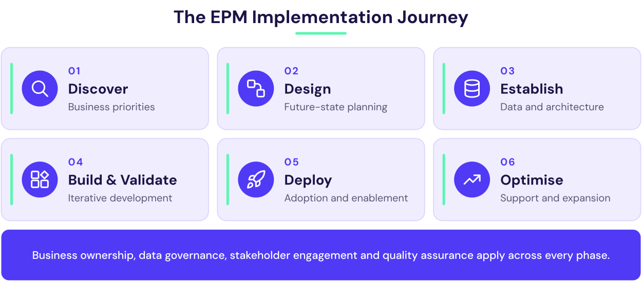
Our advisory approach starts by diagnosing planning friction and data readiness, then designing future-state processes, governance and architecture before delivering priority use cases. The six phases below provide the detailed implementation activities that support this broader Diagnose–Design–Deliver journey.
| Phase | Key Activities | Expected Outcomes |
| 1. Discover & Define | Assess existing processes, identify business challenges, conduct stakeholder workshops and prioritize requirements. | Clear project scope, business priorities and implementation roadmap. |
| 2. Design | Define future planning processes, key business drivers, calculations and cross-functional requirements. | Agreed solution design with consistent planning assumptions and processes. |
| 3. Data & Architecture | Identify data sources, establish integration requirements, define data governance and design scalable model architecture. | Reliable data foundations and a flexible, well-governed solution design. |
| 4. Build & Validate | Develop planning models iteratively, integrate data, validate calculations and conduct system and user acceptance testing. | Tested planning solutions aligned with business requirements. |
| 5. Deploy & Enable | Manage deployment, prepare documentation and establish model ownership. | Confident users, defined responsibilities and successful business adoption. |
| 6. Support & Optimize | Provide post-implementation support, optimize performance, and identify future enhancements. | Sustainable EPM capabilities supporting continuous improvement and growth. |
This approach positions technology as an enabler of business transformation, not the starting point. By aligning the operating model, data foundation, specialist calculations and change adoption, Alpha helps insurers establish connected planning capabilities that strengthen decision-making and can evolve as business needs change.
Sources and Notes
The financial examples and process diagrams are illustrative; they are not insurer results or promises of platform performance. Figures in the Australian cost diagram come from the cited source. Specialist models, professional judgment, controls and appropriate approvals remain essential. This article does not constitute regulatory compliance advice.
[1] APRA — GPS 110 Capital Adequacy, including ICAAP and capital requirements
https://www.apra.gov.au/standards/gps-110
[2] IFRS Foundation — IFRS 17 Insurance Contracts
https://www.ifrs.org/issued-standards/list-of-standards/ifrs-17-insurance-contracts/
[3] AASB — AASB 17 Insurance Contracts, December 2022 compilation for periods beginning from July 2026
https://standards.aasb.gov.au/aasb-17-dec-2022-0
[4] APRA — General insurance prudential and reporting standards, including GPS 114 and GPS 117
https://www.apra.gov.au/general-insurance/prudential-and-reporting-standards
[5] APRA — Corporate Plan 2026–27, Our operating environment
https://www.apra.gov.au/apra-corporate-plan-2026-27/our-operating-environment
[6] Insurance Council of Australia — Disaster repairs compete with new homes as rebuild costs surge, 1 September 2026
https://insurancecouncil.com.au/resource/disaster-repairs-compete-with-new-homes-as-rebuild-costs-surge/
[7] APRA — CPS 230 Operational Risk Management, version effective 1 July 2026
https://www.apra.gov.au/standards/cps-230
[8] APRA — Corporate Plan 2026–27, Our strategic objectives
https://www.apra.gov.au/apra-corporate-plan-2026-27/our-strategic-objectives
[9] ASIC — General insurance sector priorities for 2026–27, 30 September 2026
https://download.asic.gov.au/media/oliiykpy/26-232mr-asic-supervisory-letter-general-insurance-published-30-september-2026.pdf
[10] Alpha FMC — Beyond the Pilot: Overcoming the Hurdles to Enterprise Modernization in Insurance, September 2026
https://alphafmc.com/insights/beyond-the-pilot-overcoming-the-hurdles-to-enterprise-modernization-in-insurance/