


Attention spans are now a scarce and diminishing resource. If you need proof, look no further than the TV scripts being rewritten so viewers can watch them in 10-second flashes from a “second screen” and barely miss a beat.
In the business world, it’s tempting to do something similar by making your slides flashy and information-packed to capture your audience’s notice.
Here’s the problem: the average person reads roughly twice as fast as you can speak. So, the moment a dense slide appears, your audience has already devoured it—conclusion and all—while you are still on your first sentence. Your own presentation spoils the ending. The Titanic sinks, Lassie makes it home and you’ve simply handed them something to skim before they drift off, daydreaming about their next meeting.
To design memorable and effective presentations, the slides should emphasize the hardest-hitting story beats in your presentation without stealing the audience’s focus. In other words:
The focus stays on you
The worst thing you can do is let your supporting visuals become the star of the show. People put their entire message on their slides. They read paragraphs off their slides. The presenter becomes a side character in their own story. Your climactic point doesn’t have the same impact when everyone already skimmed it 30 seconds ago.
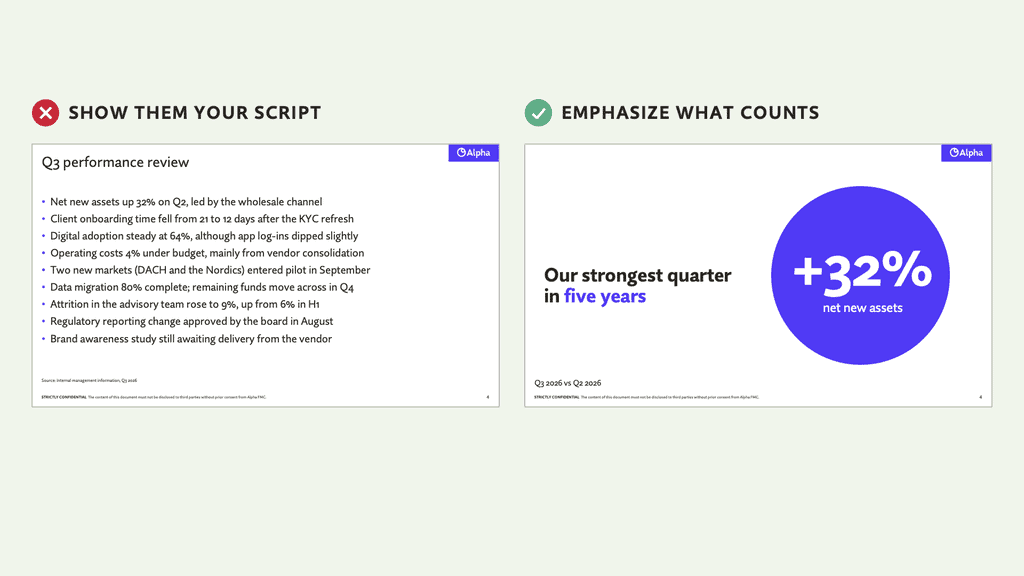
Mistakes to avoid:
- “Bullet time” puts you in slow motion
- “The essay” puts your audience to sleep
- Dense slides steal the spotlight
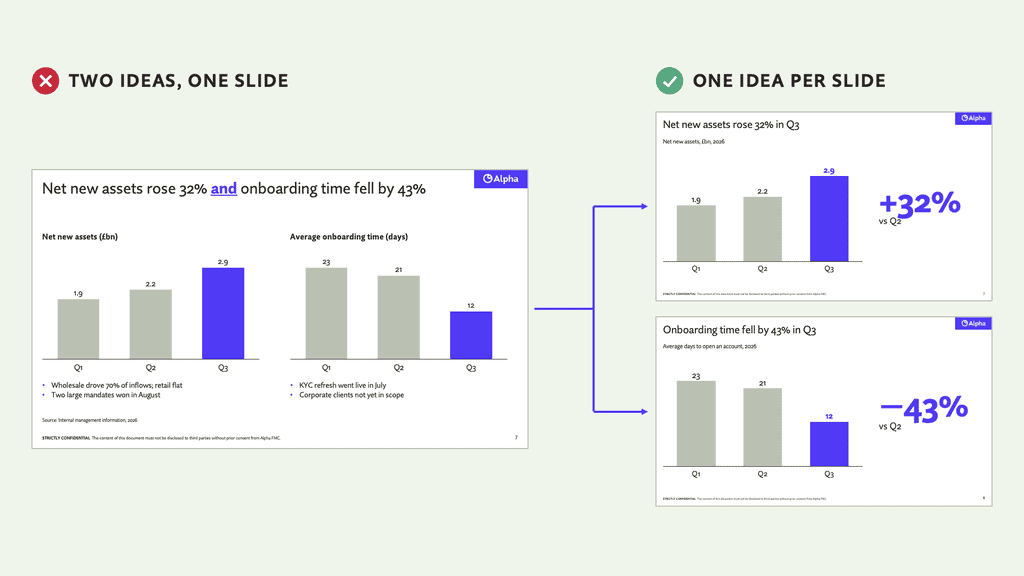
One idea per slide
Every slide has exactly one reason to exist. One figure, one insight, one question. Find that reason and give it the respect it deserves. If your slide title contains the word “and,” you have two slides. This discipline forces you to distill your talking points down to their most impactful parts. It also makes for a presentation where you breeze through slides quickly and effortlessly, keeping the audience’s attention.
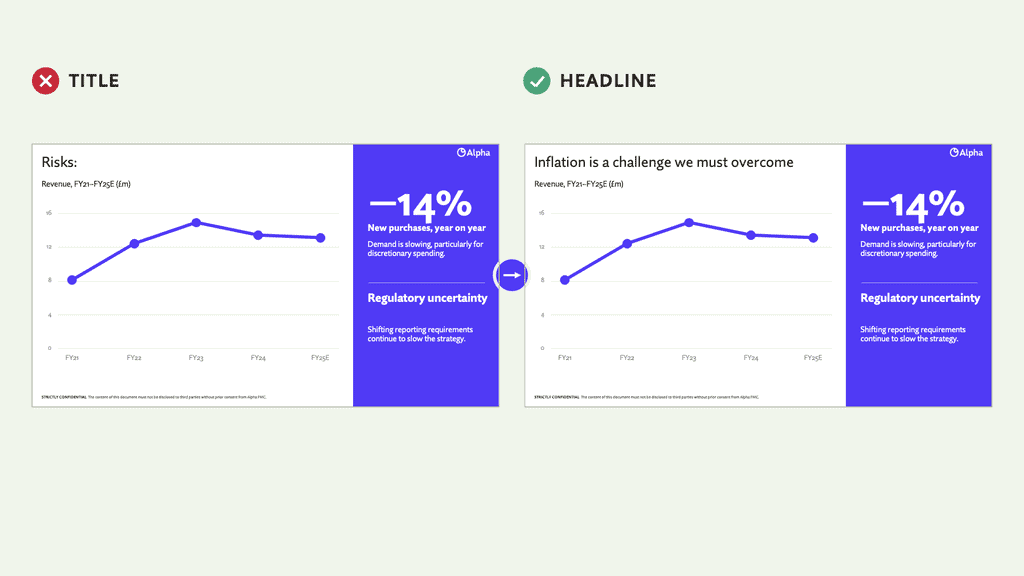
Use headlines, not titles
Slide titles shouldn’t just label topics: Agenda, Results, Strategy, etc. By wasting the most prominent part of your slide on basic descriptive text, you’re missing a big opportunity to tell a more engaging story. You can use the headline to drive home a key insight or ask the audience an attention-grabbing question.
Here is a simple test: if your audience read only the titles, would they still follow the argument? A few examples:
- “Agenda” becomes “Three decisions we need from you today”
- “Results” becomes “Net new assets beat plan by 12% in Q3”
- “Challenge” becomes “Will inflation slow our growth?”
The principles of visual design
How exactly do we make a simple idea spring off the screen and delight your weary viewer? Beautiful slides can be a real asset, but if they aren’t adding to your story, they’re getting in its way. Using design to support and sharpen your message is called visual storytelling, and it comes down to making every element on the slide earn its place.
You don’t need to be a professional designer to build clear, attractive slides. But a working knowledge of a few core design principles helps you understand how elements behave, on their own and together, and gives you strong principles to guide your layout choice.
Scannability
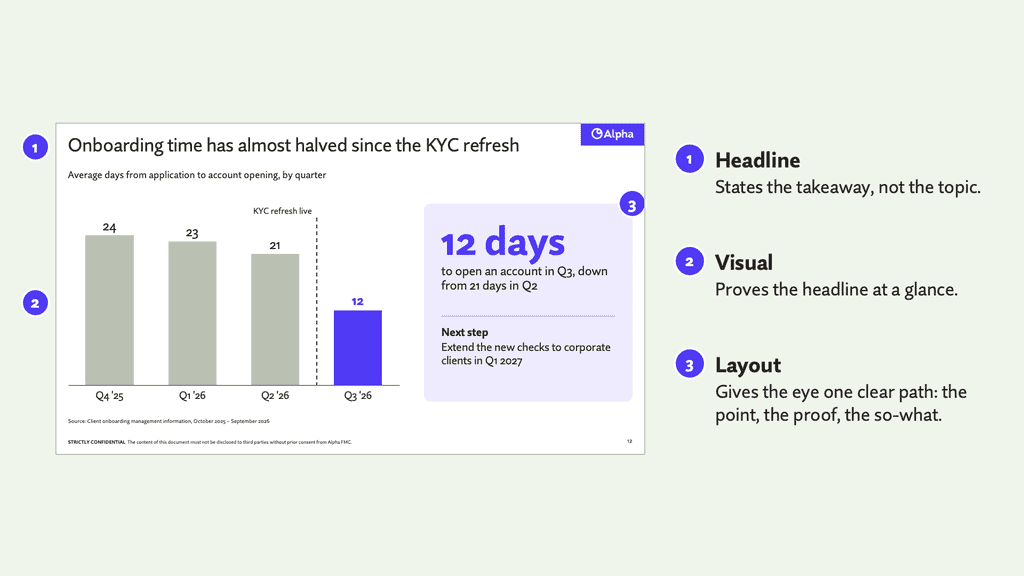
The goal is to create a clear, story-driven headline, visuals that support the content, and a layout that’s clear and easy to follow. The story of each slide should play out top-to-bottom and left-to-right, the way English speakers naturally read.
Contrast
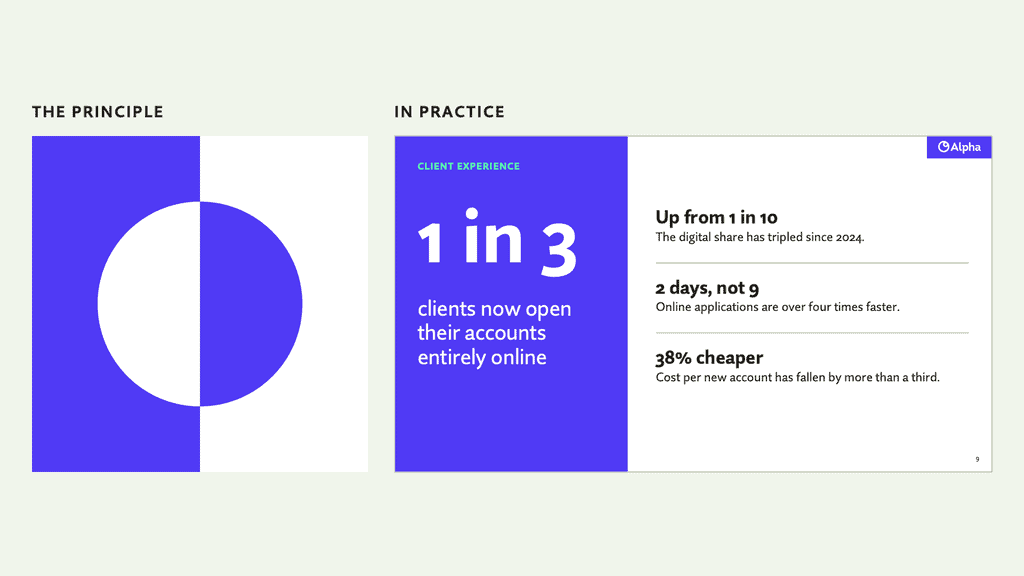
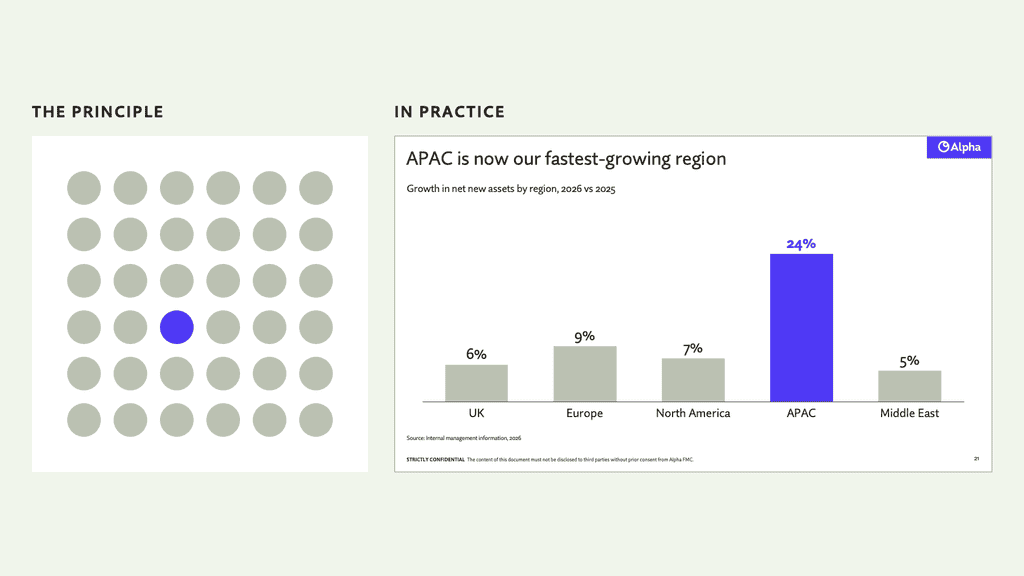
Contrast is the difference between various elements in a design—colour, size, font weight—that makes them stand out from each other. It’s a powerful tool to draw the viewer’s attention. In practice, one hero element should stand out on every slide. An easy way to differentiate these elements is to pick one, bold key colour (your brand system probably has one) and use it judiciously.
Proportion
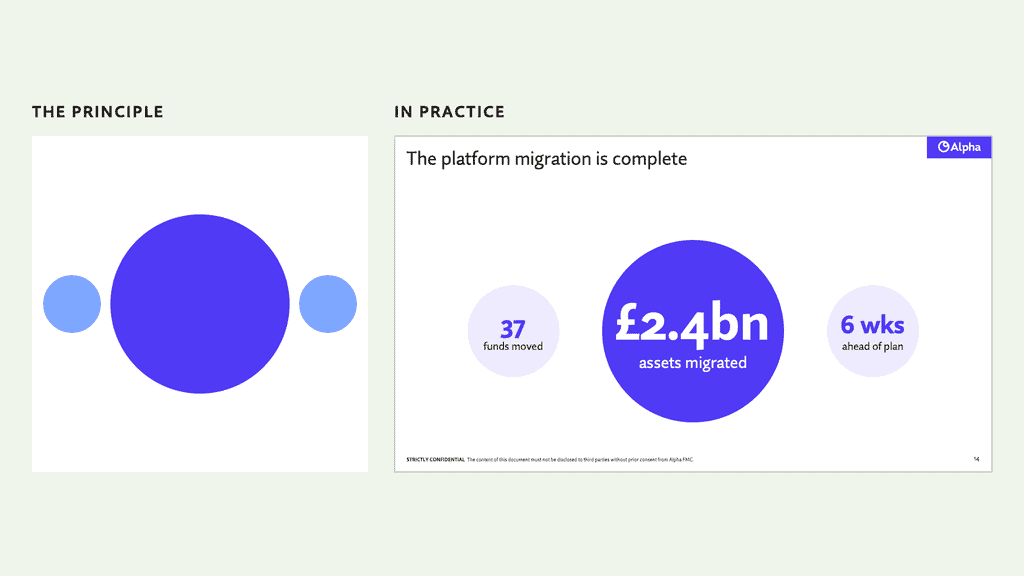
Proportion is the size of elements relative to one another. Large elements are more important and tend to be read first.
Emphasis
Together, proportion and contrast create emphasis.
Hierarchy
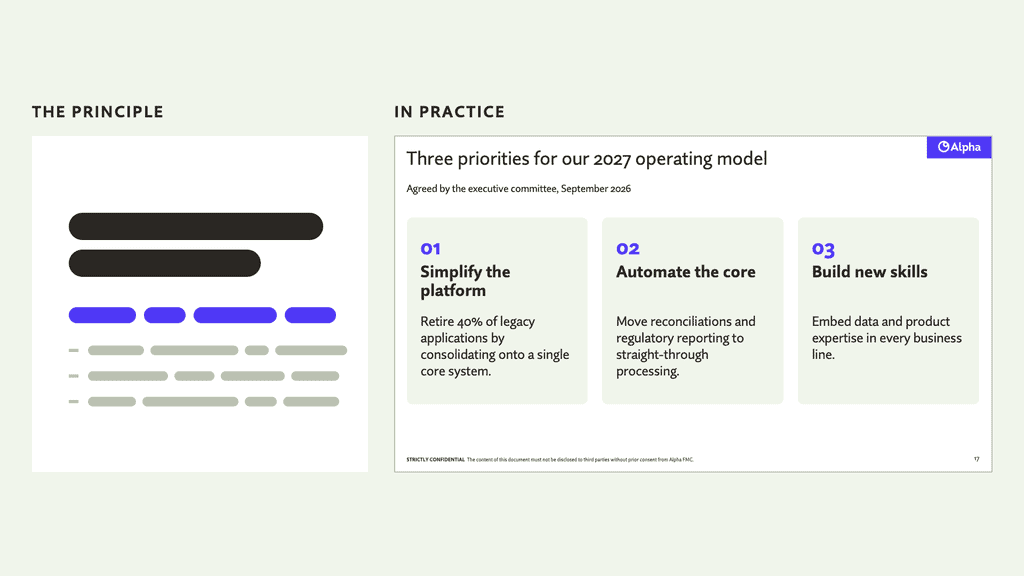
Hierarchy combines all of the above tips and recommendations: size, placement, colour, and emphasis, to signal the order of importance of every individual element. In this example, the electric blue numbers draw the audience’s eye to the bold headers. The thin, small text below is relegated to a supporting row, encouraging them to quickly scan and then return their focus to you.
Consistency
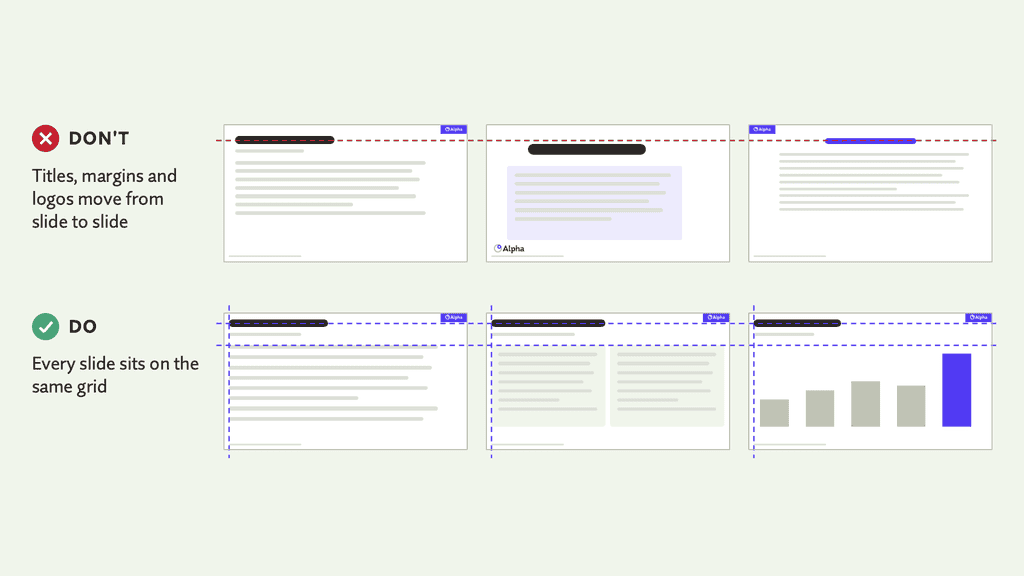
Good slides are built on consistency. Keep margins, the position of headers and logos, typefaces and colours the same from slide to slide, and your audience stays focused on your content rather than noticing that the title has jumped half an inch to the left.
The easiest way to get there is to build every slide from your template’s layouts instead of placing elements by eye. A good template makes consistency the default, not an extra effort.
Visual pacing
Consistency is a double-edged sword. If every slide looks the same, they blur into one another and interest fades fast. I’m not walking back the lesson above. Rather, subtle changes in layout, typography and imagery can be used to differentiate the acts of your story. Slides that build to a crescendo can be loud and bold. Transitionary scenes can fade into the background.
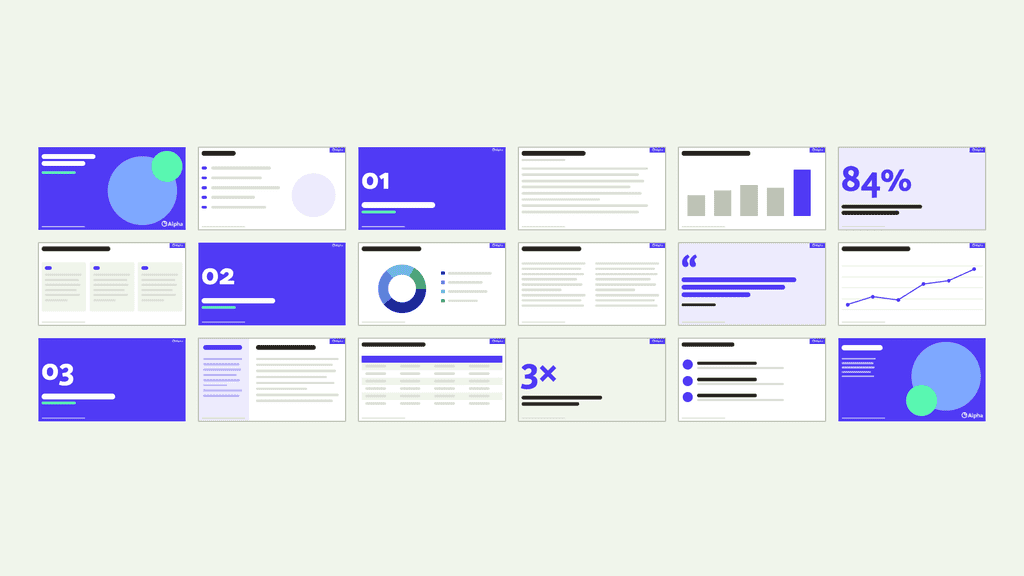
The goal isn’t to make every slide unique. Instead, settle on a handful of slide types (section breaks, content, statements and data, for example) and alternate between them to suit your content.
The example below shows visual pacing across a full deck. The colour palette and layouts stay consistent, and the same slide types recur. That’s enough variety to hold attention without reinventing the wheel on every slide.
Design a separate leave-behind
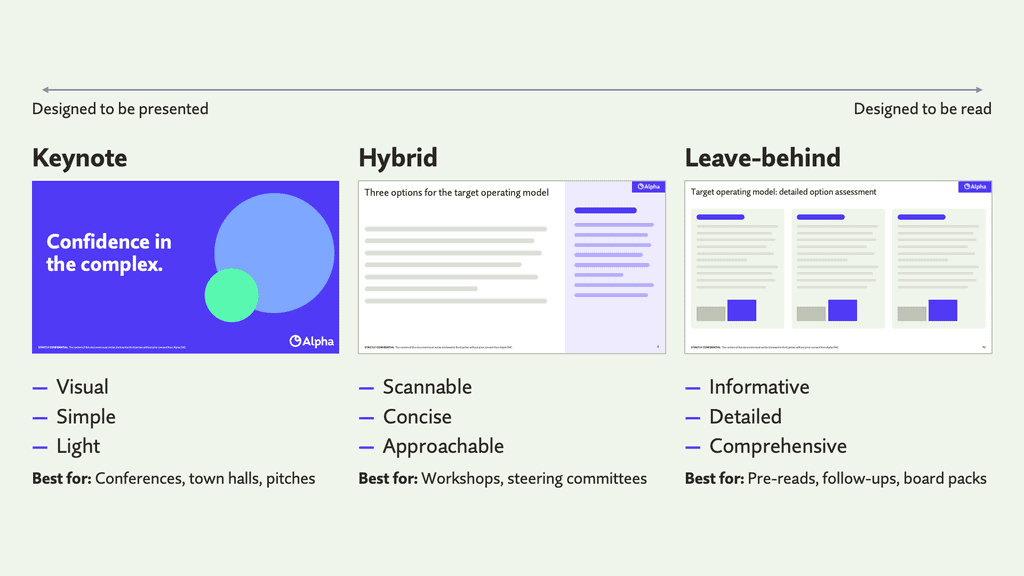
Your slides don’t have to stand on their own. The biggest mistake presenters make is forcing their slides to do double-duty as a post-meeting email. A good slide deck is boring to read, and a great report makes the presenter redundant.
Rather than diluting your presentation with dense and unnecessary information, consider using the appendix to present a standalone document that summarizes your message, key points and visuals in written form. These materials are also immensely useful during Q&A, as they arm you with supporting visuals and sources to drive the discussion.
If you are interested in finding out more about how we can stop your presentations from stealing the limelight and keep your speakers front and center, don’t hesitate to get in touch using the “contact us” button at the top of the page.
Learn more about Alpha’s creative and proposition development capabilities.